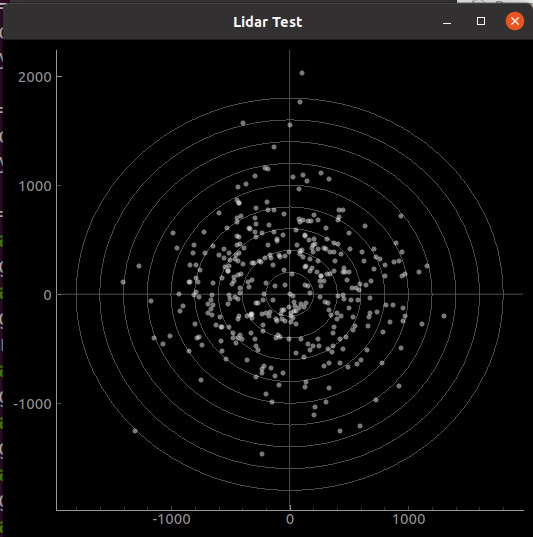
드디어 데이타를 읽고 화면에 내보내기 시작했습니다.
아직 거리 배율값이 정확히 맞지 않습니다. 형태와 방향은 정확한 듯 합니다.
이젠 그 문제만 해결하면 됩니다.
영상 :
# -*- coding: utf-8 -*-
"""
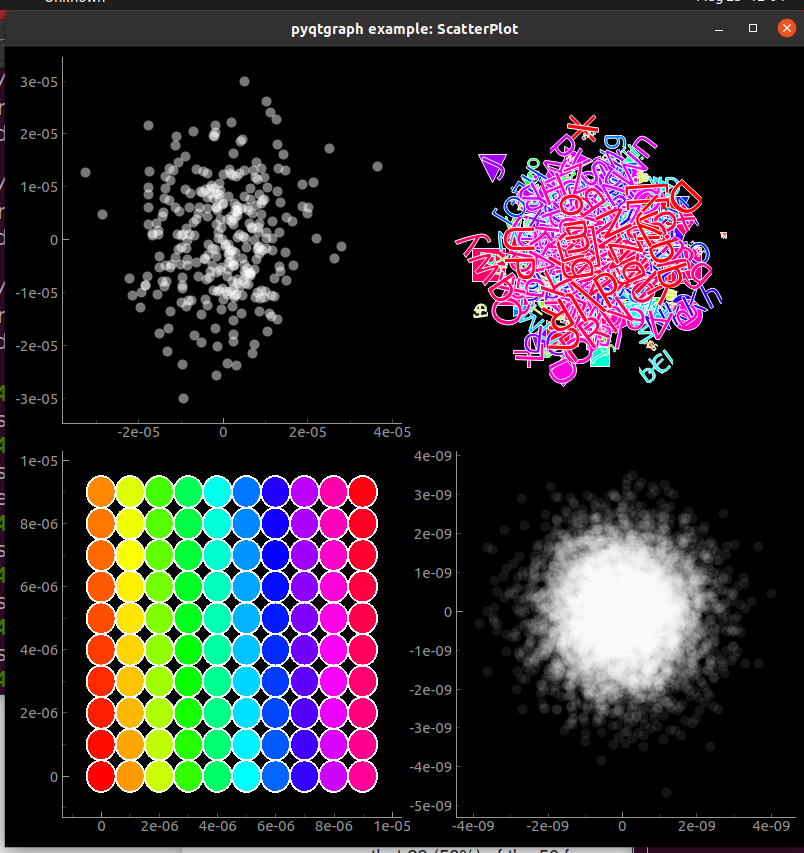
From main library's example, ScatterPlot.py,
I have taken out one of chart to make it for lidar data display.
The lidar related codes were taken from working code of Vidicon@DISCORD.
Last updated : Aug. 26, 2021
"""
from pyqtgraph.Qt import QtGui, QtCore
import pyqtgraph as pg
import numpy as np
from collections import namedtuple
from itertools import chain
import sys
import serial # For this one, you must install pyserial, not serial
from enum import Enum
import time
import math
#SERIAL_PORT = "/dev/ttyS5" # for Orange Pi Zero 2's serial port
SERIAL_PORT = "/dev/ttyUSB0" # for Other PC's USB to Serial module
class State(Enum):
START1 = 0
START2 = 1
HEADER = 2
DATA = 3
def readbytes(file, count):
data = ser.read(count)
#data = f.read(count)
if len(data) != count:
print("End of file")
return False
return data
step = (math.pi*2)
anglePlus = math.pi / 2
fullround = 1300 # max dots in 1 round, it is larger than the real max dots in slowest mode
pos = np.zeros(shape=(2, fullround))
spots = [{'pos': pos[:,i], 'data': 1} for i in range(fullround)] + [{'pos': [0,0], 'data': 1}]
file_name = "RAW_DATA.LOG"
try:
#f = open(file_name, "rb")
ser = serial.Serial(SERIAL_PORT, 153600, timeout=0.1)
time.sleep(1)
except:
print("could not connect to device")
exit()
app = QtGui.QApplication([])
mw = QtGui.QMainWindow()
mw.resize(530,500)
view = pg.GraphicsLayoutWidget() ## GraphicsView with GraphicsLayout inserted by default
mw.setCentralWidget(view)
mw.show()
mw.setWindowTitle('Lidar Test, unit in mm')
## create areas to add plots
w1 = view.addPlot()
w1.setAspectLocked()
###### Refresh Screen
def RefreshScreen():
global spots # using globla spots array will ensure that it stores & clears data in same spot
# Add polar grid lines
w1.clear() # clear screen and start drawing basic lines
w1.addLine(x=0, pen=0.3) # draw vertical center line
w1.addLine(y=0, pen=0.3) # draw horizontal center line
for radius in range(200, 2000, 200): # Draw 9 circles 200 ~ 2000 step 200
# Adding circle (x, y, width, height)
circleWidth = radius * 2
circleHeight = radius * 2
circle = pg.QtGui.QGraphicsEllipseItem(-radius, -radius, circleWidth, circleHeight)
circle.setPen(pg.mkPen(0.3))
w1.addItem(circle) # addItem means draw or plot. Here, draw circle
# clear all data in the global spots array, make sure there will be no residue dots from previous round
emptyone = np.zeros(shape=(2, fullround))
spots = [{'pos': emptyone[:,i], 'data': 1} for i in range(fullround)] + [{'pos': [0,0], 'data': 1}]
###### Get Full Circle of Data
def GetDataFromOneFullCycle():
counter = 0
ThisRoundCount = 0 # counts within one round
maxThisRound = 0 # Number of good numbers for this cycle
global pos # using globla pos array will ensure we as storing data in same spot
global spots # using globla spots array will ensure we as storing data in same spot
run = True
try:
state = State.START1
while run:
if state == State.START1:
data = ser.read(1)
#data = readbytes(f, 1)
if data[0] == 0xAA:
state = State.START2
continue
elif state == State.START2:
data = ser.read(1)
#data = readbytes(f, 1)
if data[0] == 0x55:
state = State.HEADER
else:
state = State.START1
continue
elif state == State.HEADER:
data = ser.read(8)
#data = readbytes(f, 8)
pack_type = data[0]
data_lenght = int(data[1])
start_angle = int(data[3] << 8) + int(data[2])
stop_angle = int(data[5] << 8) + int(data[4])
#unknown = int(data[7] << 8) + int(data[6])
diff = stop_angle - start_angle
if stop_angle < start_angle:
diff = 0xB400 - start_angle + stop_angle
angle_per_sample = 0
if diff > 1 and (data_lenght-1) > 0:
angle_per_sample = diff / (data_lenght-1)
#print("[{}]\ttype:{},\tlenght {},\tstart: {},\tstop: {}, \tdiff: {} \tdiff: {}"
# .format(counter, pack_type, data_lenght, start_angle, stop_angle, diff, angle_per_sample), end="\n")
counter += 1
#if pack_type != 40:
# counter = 0
state = State.DATA
continue
elif state == State.DATA:
state = State.START1
#read data
data = ser.read(data_lenght * 3)
#data = readbytes(f, data_lenght * 3)
if data == False:
break
for i in range(0, data_lenght):
data0 = int(data[i*3 + 0])
data1 = int(data[i*3 + 1])
data2 = int(data[i*3 + 2])
distance = (data2 << 8) + data1
angle = (start_angle + angle_per_sample * i)
anglef = step * (angle / 0xB400)
#print("[{}]\tangle:{},\tanglef {},\tdist: {}".format(i, data0, (anglef + anglePlus), (distance/1000)), end="\n")
distanceDivided = distance / 1000 # div to convert mm to meter
#if (data0 != 1) & (distanceDivided < 3) :
if (distanceDivided < 60) :
distanceDivided = (distance/5) # Adjust distance ratio. It is too large
x = distanceDivided * np.cos(anglef)
y = distanceDivided * np.sin(anglef)
pos[0][ThisRoundCount] = y
pos[1][ThisRoundCount] = x
#print("[{}]\tDistance:{},\tanglef {},\tx:y: {}{}".format(ThisRoundCount, distanceDivided, anglef, x, y), end="\n")
ThisRoundCount += 1
if pack_type != 40: # After 1 full round
spots = [{'pos': pos[:,i], 'data': 1} for i in range(ThisRoundCount)] + [{'pos': [0,0], 'data': 1}]
ThisRoundCount = 0
ser.reset_input_buffer() # This will clear serial line buffer, make update almost realtime.
run = False # Completed the mission of filling data in spots, now exit to draw step.
else:
print("error")
except KeyboardInterrupt:
run = False
exit()
###### I have to focus on putting data here.
def _update():
RefreshScreen() # Draw basic chart with no data dots
GetDataFromOneFullCycle() # Get Full cycle of data from either File or Serial, prepare "spots"
s1 = pg.ScatterPlotItem(size=5, pen=pg.mkPen(None), brush=pg.mkBrush(127, 255, 127, 120))
s1.addPoints(spots)
# addItem means draw or plot. Here, plot all points
w1.addItem(s1, ignoreBounds = True) # ignoreBounds will prevent annoying rescaling
timer = QtCore.QTimer(interval=1)
timer.timeout.connect(_update)
#timer.start(0.1) # duration number in millisecond
timer.start() # A.S.A.P.
if __name__ == '__main__':
import sys
if (sys.flags.interactive != 1) or not hasattr(QtCore, 'PYQT_VERSION'):
QtGui.QApplication.instance().exec_()'PyQtGraph 공부.' 카테고리의 다른 글
| making Lidar - step 04 : Refresh Screen (0) | 2021.08.24 |
|---|---|
| making Lidar - step 03 : Timer added (0) | 2021.08.24 |
| making Lidar - step 02 : One selected and circles drawn (0) | 2021.08.24 |
| making Lidar - step 01 : basic dots (0) | 2021.08.24 |
| Study 8 : Scatter Plotting (선 없이 점만 찍기) (0) | 2021.08.24 |