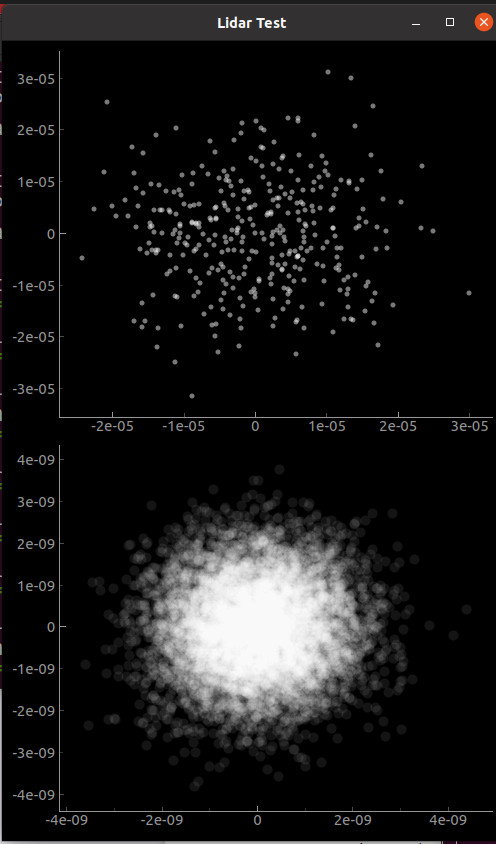
원래 프로그램에서 기초 점찍는 부분들만 뽑아낸 기둥.

(my local file name :  ~/py/pyqtgraph/l-01_basic_dots.py


# -*- coding: utf-8 -*-
"""
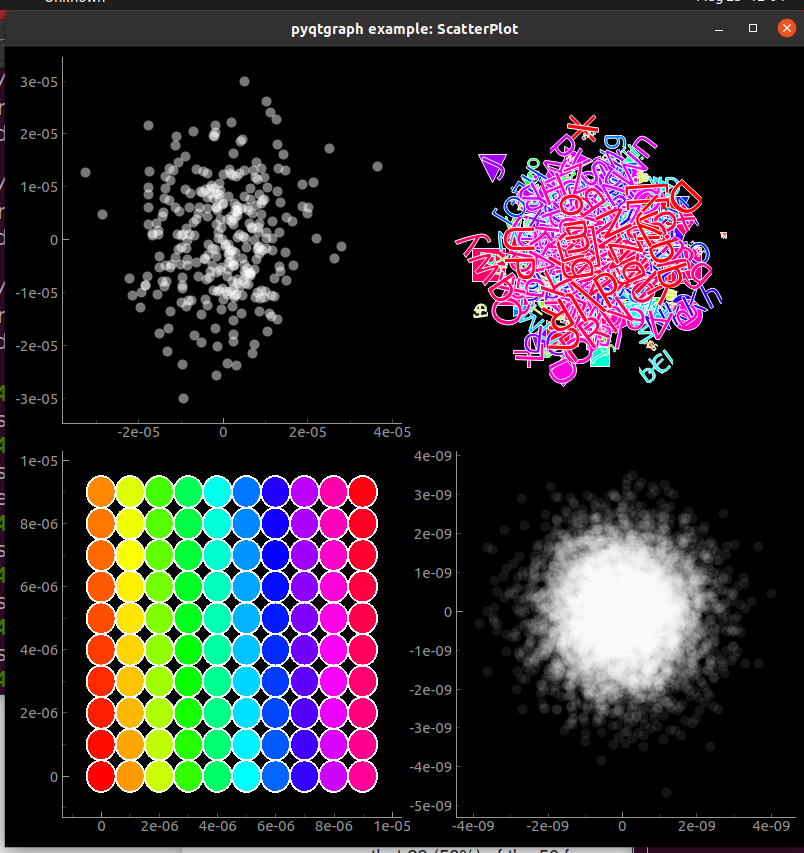
From main library's example, ScatterPlot.py, 
I will take out one of chart to make it for Lidar data display.
"""
from pyqtgraph.Qt import QtGui, QtCore
import pyqtgraph as pg
import numpy as np
from collections import namedtuple
from itertools import chain

app = QtGui.QApplication([])
mw = QtGui.QMainWindow()
mw.resize(500,800)
view = pg.GraphicsLayoutWidget()  ## GraphicsView with GraphicsLayout inserted by default
mw.setCentralWidget(view)
mw.show()
mw.setWindowTitle('Lidar Test')

## create four areas to add plots
w1 = view.addPlot()
view.nextRow()
w4 = view.addPlot()
print("Generating data, this takes a few seconds...")

## There are a few different ways we can draw scatter plots; each is optimized for different types of data:

## 1) All spots identical and transform-invariant (top-left plot).
## In this case we can get a huge performance boost by pre-rendering the spot
## image and just drawing that image repeatedly.

n = 360
s1 = pg.ScatterPlotItem(size=5, pen=pg.mkPen(None), brush=pg.mkBrush(255, 255, 255, 120))
pos = np.random.normal(size=(2,n), scale=1e-5)
spots = [{'pos': pos[:,i], 'data': 1} for i in range(n)] + [{'pos': [0,0], 'data': 1}]
s1.addPoints(spots)
w1.addItem(s1)

## Test performance of large scatterplots

s4 = pg.ScatterPlotItem(
    size=10,
    pen=pg.mkPen(None),
    brush=pg.mkBrush(255, 255, 255, 20),
    hoverable=True,
    hoverSymbol='s',
    hoverSize=15,
    hoverPen=pg.mkPen('r', width=2),
    hoverBrush=pg.mkBrush('g'),
)
n = 10000
pos = np.random.normal(size=(2, n), scale=1e-9)
s4.addPoints(
    x=pos[0],
    y=pos[1],
    #size=(np.random.random(n) * 20.).astype(int),
    #brush=[pg.mkBrush(x) for x in np.random.randint(0, 256, (n, 3))],
    data=np.arange(n)
)
w4.addItem(s4)

if __name__ == '__main__':
    import sys
    if (sys.flags.interactive != 1) or not hasattr(QtCore, 'PYQT_VERSION'):
        QtGui.QApplication.instance().exec_()

원래 따라오는 데모를 혼자 돌게 고친 내용.   그 과정에서 2줄을 블락을 시켰는데 전체 과정에 큰 차이가 없어서 다행입니다.


# -*- coding: utf-8 -*-
"""
Example demonstrating a variety of scatter plot features.
"""


from pyqtgraph.Qt import QtGui, QtCore
import pyqtgraph as pg
import numpy as np
from collections import namedtuple
from itertools import chain

app = QtGui.QApplication([])
mw = QtGui.QMainWindow()
mw.resize(800,800)
view = pg.GraphicsLayoutWidget()  ## GraphicsView with GraphicsLayout inserted by default
mw.setCentralWidget(view)
mw.show()
mw.setWindowTitle('pyqtgraph example: ScatterPlot')

## create four areas to add plots
w1 = view.addPlot()
w2 = view.addViewBox()
w2.setAspectLocked(True)
view.nextRow()
w3 = view.addPlot()
w4 = view.addPlot()
print("Generating data, this takes a few seconds...")

## Make all plots clickable
clickedPen = pg.mkPen('b', width=2)
lastClicked = []
def clicked(plot, points):
    global lastClicked
    for p in lastClicked:
        p.resetPen()
    print("clicked points", points)
    for p in points:
        p.setPen(clickedPen)
    lastClicked = points


## There are a few different ways we can draw scatter plots; each is optimized for different types of data:

## 1) All spots identical and transform-invariant (top-left plot).
## In this case we can get a huge performance boost by pre-rendering the spot
## image and just drawing that image repeatedly.

n = 300
s1 = pg.ScatterPlotItem(size=10, pen=pg.mkPen(None), brush=pg.mkBrush(255, 255, 255, 120))
pos = np.random.normal(size=(2,n), scale=1e-5)
spots = [{'pos': pos[:,i], 'data': 1} for i in range(n)] + [{'pos': [0,0], 'data': 1}]
s1.addPoints(spots)
w1.addItem(s1)
s1.sigClicked.connect(clicked)


## 2) Spots are transform-invariant, but not identical (top-right plot).
## In this case, drawing is almsot as fast as 1), but there is more startup
## overhead and memory usage since each spot generates its own pre-rendered
## image.

TextSymbol = namedtuple("TextSymbol", "label symbol scale")

def createLabel(label, angle):
    symbol = QtGui.QPainterPath()
    #symbol.addText(0, 0, QFont("San Serif", 10), label)
    f = QtGui.QFont()
    f.setPointSize(10)
    symbol.addText(0, 0, f, label)
    br = symbol.boundingRect()
    scale = min(1. / br.width(), 1. / br.height())
    tr = QtGui.QTransform()
    tr.scale(scale, scale)
    tr.rotate(angle)
    tr.translate(-br.x() - br.width()/2., -br.y() - br.height()/2.)
    return TextSymbol(label, tr.map(symbol), 0.1 / scale)

random_str = lambda : (''.join([chr(np.random.randint(ord('A'),ord('z'))) for i in range(np.random.randint(1,5))]), np.random.randint(0, 360))

s2 = pg.ScatterPlotItem(size=10, pen=pg.mkPen('w'), pxMode=True)
pos = np.random.normal(size=(2,n), scale=1e-5)
spots = [{'pos': pos[:,i], 'data': 1, 'brush':pg.intColor(i, n), 'symbol': i%10, 'size': 5+i/10.} for i in range(n)]
s2.addPoints(spots)
spots = [{'pos': pos[:,i], 'data': 1, 'brush':pg.intColor(i, n), 'symbol': label[1], 'size': label[2]*(5+i/10.)} for (i, label) in [(i, createLabel(*random_str())) for i in range(n)]]
s2.addPoints(spots)
w2.addItem(s2)
s2.sigClicked.connect(clicked)


## 3) Spots are not transform-invariant, not identical (bottom-left).
## This is the slowest case, since all spots must be completely re-drawn
## every time because their apparent transformation may have changed.

s3 = pg.ScatterPlotItem(
    pxMode=False,  # Set pxMode=False to allow spots to transform with the view
    hoverable=True,
    hoverPen=pg.mkPen('g'),
    hoverSize=1e-6
)
spots3 = []
for i in range(10):
    for j in range(10):
        spots3.append({'pos': (1e-6*i, 1e-6*j), 'size': 1e-6, 'pen': {'color': 'w', 'width': 2}, 'brush':pg.intColor(i*10+j, 100)})
s3.addPoints(spots3)
w3.addItem(s3)
s3.sigClicked.connect(clicked)

## Test performance of large scatterplots

s4 = pg.ScatterPlotItem(
    size=10,
    pen=pg.mkPen(None),
    brush=pg.mkBrush(255, 255, 255, 20),
    hoverable=True,
    hoverSymbol='s',
    hoverSize=15,
    hoverPen=pg.mkPen('r', width=2),
    hoverBrush=pg.mkBrush('g'),
)
n = 10000
pos = np.random.normal(size=(2, n), scale=1e-9)
s4.addPoints(
    x=pos[0],
    y=pos[1],
    # size=(np.random.random(n) * 20.).astype(int),
    # brush=[pg.mkBrush(x) for x in np.random.randint(0, 256, (n, 3))],
    data=np.arange(n)
)
w4.addItem(s4)
s4.sigClicked.connect(clicked)

if __name__ == '__main__':
    import sys
    if (sys.flags.interactive != 1) or not hasattr(QtCore, 'PYQT_VERSION'):
        QtGui.QApplication.instance().exec_()

+ Recent posts